Recently I explored a few options to measure the performance of compression of directory files on Linux.
Usually, if I would want to measure the time consumed; appending the keyword ‘time’ helped. However, this time I was suggested to check the libraries being invoked underneath. This led me to ‘perf’ command which we are going to look into today.
First, let’s go back in ‘time‘. For our experiment, we are going to create a simple while loop in bash as follows:
Using “time” command on the above script:
[root@centosstream9 ~]# time sh command_loop.sh
0
1
..

..
9
Number 10!
Done!

real    0m0.520s
user    0m0.007s
sys     0m0.000s
In the above output:
real: total time command took to execute
user: Time spent in user-space
sys: Time spent in kernel space
If we want to really dig deep into how our command is spending time on Linux system calls, CPU cycles, etc.; we should use perf utility. I have Centos 9 machine where I have installed this utility using “yum install perf -y“
A quick look at the help of the perf command gives us this:
[root@centosstream9 ~]# perf --help

 usage: perf [--version] [--help] [OPTIONS] COMMAND [ARGS]

 The most commonly used perf commands are:
   annotate        Read perf.data (created by perf record) and display annotated code
   archive         Create archive with object files with build-ids found in perf.data file
   bench           General framework for benchmark suites
   buildid-cache   Manage build-id cache.
   buildid-list    List the buildids in a perf.data file
   c2c             Shared Data C2C/HITM Analyzer.
   config          Get and set variables in a configuration file.
   daemon          Run record sessions on background
   data            Data file related processing
   diff            Read perf.data files and display the differential profile
   evlist          List the event names in a perf.data file
   ftrace          simple wrapper for kernel's ftrace functionality
   inject          Filter to augment the events stream with additional information
   iostat          Show I/O performance metrics
   kallsyms        Searches running kernel for symbols
   kmem            Tool to trace/measure kernel memory properties
   kvm             Tool to trace/measure kvm guest os
   kwork           Tool to trace/measure kernel work properties (latencies)
   list            List all symbolic event types
   lock            Analyze lock events
   mem             Profile memory accesses
   record          Run a command and record its profile into perf.data
   report          Read perf.data (created by perf record) and display the profile
   sched           Tool to trace/measure scheduler properties (latencies)
   script          Read perf.data (created by perf record) and display trace output
   stat            Run a command and gather performance counter statistics
   test            Runs sanity tests.
   timechart       Tool to visualize total system behavior during a workload
   top             System profiling tool.
   version         display the version of perf binary
   probe           Define new dynamic tracepoints
   trace           strace inspired tool

 See 'perf help COMMAND' for more information on a specific command.
Examples of perf command:
1. Simple usage of command:
perf record -o <PERFORMANCE_FILE_DATA> <LINUX COMMAND TO EXECUTE>
Executing the above on our bash script:
[root@centosstream9 ~]# perf record -o command_script_execution_record.data sh command_loop.sh
0
1
...
...
9
Number 10!
Done!
[ perf record: Woken up 1 times to write data ]
[ perf record: Captured and wrote 0.012 MB command_script_execution_record.data (24 samples) ]
[root@centosstream9 ~]# ll
total 28
-rw-------. 1 root root  1134 Dec  5  2021 anaconda-ks.cfg
-rw-r--r--. 1 root root   217 May 21 07:44 command_loop.sh
-rw-------. 1 root root 20080 May 21 08:43 command_script_execution_record.data
2. Check what data is captured in the performance data file:
perf report -i <performance_data_file> –header.
The output of the above command for our performance file:
# ========
# captured on : Sun May 21 09:07:38 2023
# header version : 1
# data offset : 256
# data size : 12008
# feat offset : 12264
# hostname : centosstream9.linuxvmimages.local
# os release : 5.14.0-22.el9.x86_64
# perf version : 5.14.0-312.el9.x86_64
# arch : x86_64
# nrcpus online : 1
# nrcpus avail : 1
# cpudesc : 11th Gen Intel(R) Core(TM) i5-1135G7 @ 2.40GHz
# cpuid : GenuineIntel,6,140,1
# total memory : 1817896 kB
# cmdline : /usr/bin/perf record -o command_script_execution_record.data sh command_loop.sh
# event : name = cpu-clock:pppH, , id = { 19 }, type = 1, size = 128, { sample_period, sample_freq } = 4000, sample_type = IP|TID|TIME|PERIOD, read_format = ID, disabled = 1, inherit = 1, mmap = 1, comm = 1, freq = 1, enable_on_exec = 1, task = 1, precise_ip = 3, sample_id_all = 1, exclude_guest = 1, mmap2 = 1, comm_exec = 1, ksymbol = 1, bpf_event = 1
# CPU_TOPOLOGY info available, use -I to display
# NUMA_TOPOLOGY info available, use -I to display
# pmu mappings: software = 1, uprobe = 7, breakpoint = 5, tracepoint = 2, kprobe = 6, msr = 8
# CACHE info available, use -I to display
# time of first sample : 7411.707292
# time of last sample : 7412.232653
# sample duration : 525.361 ms
# MEM_TOPOLOGY info available, use -I to display
# bpf_prog_info 22: bpf_prog_40ddf486530245f5 addr 0xffffffffc02660ac size 309
# bpf_prog_info 23: bpf_prog_6deef7357e7b4530 addr 0xffffffffc026888c size 54
# bpf_prog_info 24: bpf_prog_6deef7357e7b4530 addr 0xffffffffc026ac78 size 54
# bpf_prog_info 25: bpf_prog_ca8e50a3c7fb034b addr 0xffffffffc02624a4 size 307
# bpf_prog_info 26: bpf_prog_6deef7357e7b4530 addr 0xffffffffc02cc6ec size 54
# bpf_prog_info 27: bpf_prog_6deef7357e7b4530 addr 0xffffffffc02d2738 size 54
# bpf_prog_info 28: bpf_prog_3a0ef5414c2f6fca addr 0xffffffffc0869a80 size 447
# bpf_prog_info 29: bpf_prog_6deef7357e7b4530 addr 0xffffffffc086bd1c size 54
# bpf_prog_info 30: bpf_prog_6deef7357e7b4530 addr 0xffffffffc086d010 size 54
# bpf_prog_info 31: bpf_prog_ee0e253c78993a24 addr 0xffffffffc08ad840 size 255
# missing features: TRACING_DATA BRANCH_STACK GROUP_DESC AUXTRACE STAT CLOCKID DIR_FORMAT COMPRESSED CPU_PMU_CAPS CLOCK_DATA HYBRID_TOPOLOGY
# ========
#
#
# Total Lost Samples: 0
#
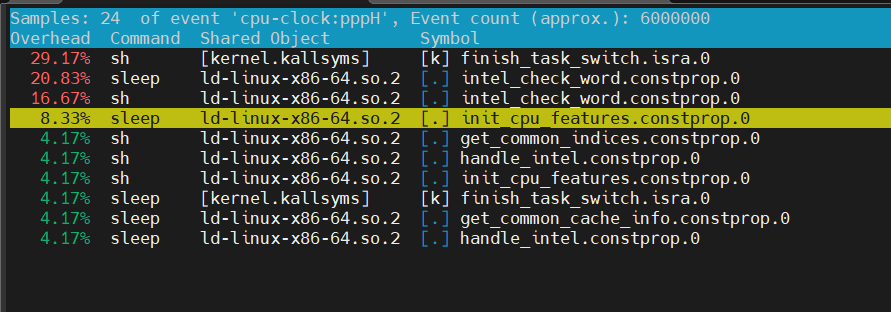
# Samples: 24 of event 'cpu-clock:pppH'
# Event count (approx.): 6000000
#
# Overhead Command Shared Object Symbol
# ........ ....... .................... .....................................
#
29.17% sh [kernel.kallsyms] [k] finish_task_switch.isra.0
20.83% sleep ld-linux-x86-64.so.2 [.] intel_check_word.constprop.0
16.67% sh ld-linux-x86-64.so.2 [.] intel_check_word.constprop.0
8.33% sleep ld-linux-x86-64.so.2 [.] init_cpu_features.constprop.0
4.17% sh ld-linux-x86-64.so.2 [.] get_common_indices.constprop.0
4.17% sh ld-linux-x86-64.so.2 [.] handle_intel.constprop.0
4.17% sh ld-linux-x86-64.so.2 [.] init_cpu_features.constprop.0
4.17% sleep [kernel.kallsyms] [k] finish_task_switch.isra.0
4.17% sleep ld-linux-x86-64.so.2 [.] get_common_cache_info.constprop.0
4.17% sleep ld-linux-x86-64.so.2 [.] handle_intel.constprop.0
The “Symbol” field points to the functions from the kernel source code. Shared Object points to libraries on the system which run your command.
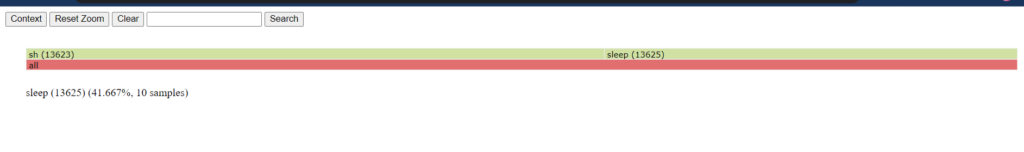
3. Export the data into sqlite db, postgresql db, or generate a flame-graph with the performance data file.
How to do it? Just run: perf report -i <perf_data_file> and then you will see the following events:
and then:
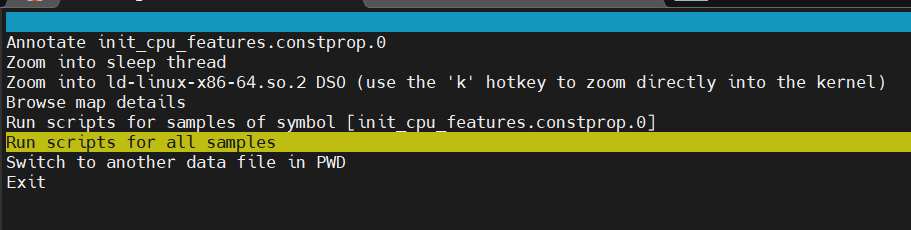
and then select the option you want to do.
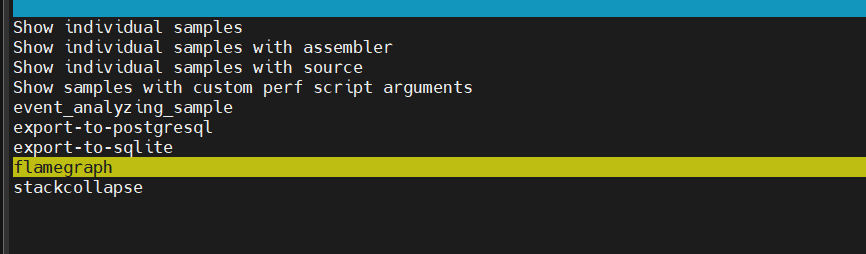
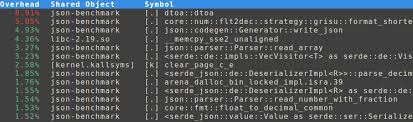
Note: To generate a flame-graph, you need to have the js-d3-flame-graph library installed and the name of the file has to be perf.data(just rename your generated perf data file). This generated an HTML file, which looks like this:
4. See all the events from performance data:
perf script -i <perf_data_file>
The output of above command on our performance data file:
[root@centosstream9 ~]# perf script -i ./command_script_execution_record.data
              sh 13623  7411.707292:     250000 cpu-clock:pppH:      7f37c7e173fa get_common_indices.constprop.0+0x7a (/usr/lib64/ld-linux-x86-64.so.2)
              sh 13623  7411.707562:     250000 cpu-clock:pppH:      7f37c7e18e39 init_cpu_features.constprop.0+0xcf9 (/usr/lib64/ld-linux-x86-64.so.2)
              sh 13623  7411.707782:     250000 cpu-clock:pppH:      7f37c7e179f4 intel_check_word.constprop.0+0x124 (/usr/lib64/ld-linux-x86-64.so.2)       ◆
              sh 13623  7411.708069:     250000 cpu-clock:pppH:      7f37c7e17b92 handle_intel.constprop.0+0x52 (/usr/lib64/ld-linux-x86-64.so.2)
              sh 13623  7411.708319:     250000 cpu-clock:pppH:      7f37c7e179f4 intel_check_word.constprop.0+0x124 (/usr/lib64/ld-linux-x86-64.so.2)       ▒
              sh 13623  7411.708567:     250000 cpu-clock:pppH:      7f37c7e179f4 intel_check_word.constprop.0+0x124 (/usr/lib64/ld-linux-x86-64.so.2)
              sh 13623  7411.708801:     250000 cpu-clock:pppH:      7f37c7e179f4 intel_check_word.constprop.0+0x124 (/usr/lib64/ld-linux-x86-64.so.2)       ▒
              sh 13623  7411.710569:     250000 cpu-clock:pppH:  ffffffffb3116f0b finish_task_switch.isra.0+0xbb ([kernel.kallsyms])
              sh 13623  7411.713140:     250000 cpu-clock:pppH:  ffffffffb3116f0b finish_task_switch.isra.0+0xbb ([kernel.kallsyms])
              sh 13623  7411.716419:     250000 cpu-clock:pppH:  ffffffffb3116f0b finish_task_switch.isra.0+0xbb ([kernel.kallsyms])
              sh 13623  7411.720121:     250000 cpu-clock:pppH:  ffffffffb3116f0b finish_task_switch.isra.0+0xbb ([kernel.kallsyms])                         ▒
              sh 13623  7411.721515:     250000 cpu-clock:pppH:  ffffffffb3116f0b finish_task_switch.isra.0+0xbb ([kernel.kallsyms])
              sh 13623  7411.724388:     250000 cpu-clock:pppH:  ffffffffb3116f0b finish_task_switch.isra.0+0xbb ([kernel.kallsyms])
           sleep 13625  7411.727006:     250000 cpu-clock:pppH:      7ff8d52e8170 init_cpu_features.constprop.0+0x30 (/usr/lib64/ld-linux-x86-64.so.2)
           sleep 13625  7411.727284:     250000 cpu-clock:pppH:      7ff8d52e8e87 init_cpu_features.constprop.0+0xd47 (/usr/lib64/ld-linux-x86-64.so.2)
           sleep 13625  7411.727571:     250000 cpu-clock:pppH:      7ff8d52e79f4 intel_check_word.constprop.0+0x124 (/usr/lib64/ld-linux-x86-64.so.2)       ▒
           sleep 13625  7411.727857:     250000 cpu-clock:pppH:      7ff8d52e79f4 intel_check_word.constprop.0+0x124 (/usr/lib64/ld-linux-x86-64.so.2)
           sleep 13625  7411.728062:     250000 cpu-clock:pppH:      7ff8d52e79f4 intel_check_word.constprop.0+0x124 (/usr/lib64/ld-linux-x86-64.so.2)
           sleep 13625  7411.728279:     250000 cpu-clock:pppH:      7ff8d52e7b92 handle_intel.constprop.0+0x52 (/usr/lib64/ld-linux-x86-64.so.2)
           sleep 13625  7411.728527:     250000 cpu-clock:pppH:      7ff8d52e79f4 intel_check_word.constprop.0+0x124 (/usr/lib64/ld-linux-x86-64.so.2)
           sleep 13625  7411.728775:     250000 cpu-clock:pppH:      7ff8d52e79f4 intel_check_word.constprop.0+0x124 (/usr/lib64/ld-linux-x86-64.so.2)
           sleep 13625  7411.729058:     250000 cpu-clock:pppH:      7ff8d52e7608 get_common_cache_info.constprop.0+0xe8 (/usr/lib64/ld-linux-x86-64.so.2)
           sleep 13625  7412.230184:     250000 cpu-clock:pppH:  ffffffffb3116f0b finish_task_switch.isra.0+0xbb ([kernel.kallsyms])
              sh 13623  7412.232653:     250000 cpu-clock:pppH:  ffffffffb3116f0b finish_task_switch.isra.0+0xbb ([kernel.kallsyms])
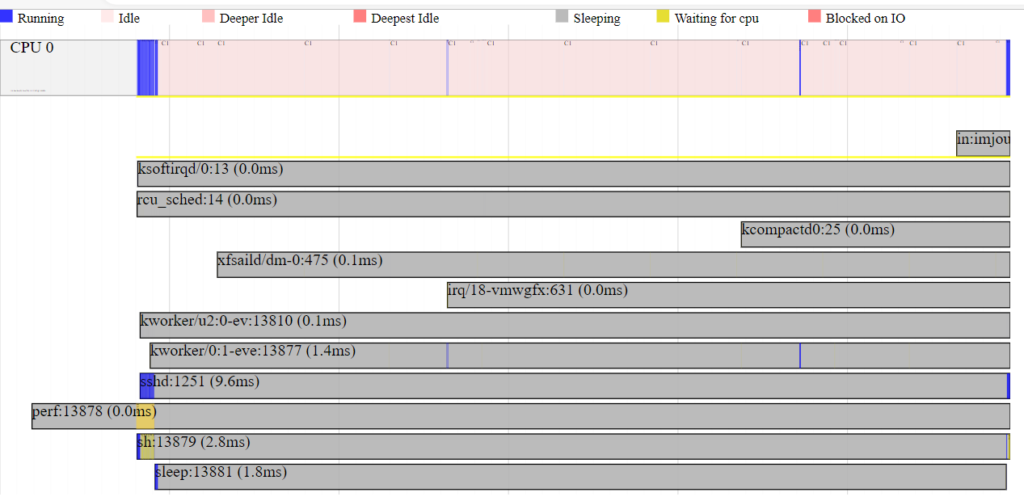
5. Generate Time chart data:
Perf tool even allows you to zoom into kernel calls and get call graphs. To generate time chart data, run the command, run perf with timechart options: perf timechart record <Linux command here>. This generates an SVG file that looks like this:
6. Record kernel memory: use perf kmem (you need to interrupt it to record the data to a file) or you can give “sleep <timeout>” at the end:
[root@centosstream9 ~]# perf kmem --slab record
[ perf record: Woken up 0 times to write data ]
Warning:
Processed 24165116 events and lost 6 chunks!

Check IO/CPU overload!

[ perf record: Captured and wrote 1416.506 MB perf.data (16131228 samples) ]


[root@centosstream9 ~]# perf kmem stat
Warning:
Processed 24165116 events and lost 6 chunks!
Check IO/CPU overload!

SUMMARY (SLAB allocator)
========================
Total bytes requested: 9,590,832
Total bytes allocated: 9,700,896
Total bytes freed:     6,271,416
Net total bytes allocated: 3,429,480
Total bytes wasted on internal fragmentation: 110,064
Internal fragmentation: 1.134576%
Cross CPU allocations: 129/24,912
7. Record CPU cycles for 10 seconds:
perf record -a -o <perf_data_file> sleep 10
Output:
# Samples: 27K of event 'cpu-clock:pppH'
# Event count (approx.): 6906000000
#
# Overhead  Command          Shared Object         Symbol
# ........  ...............  ....................  .................................................
#
    99.56%  swapper          [kernel.kallsyms]     [k] default_idle
     0.11%  swapper          [kernel.kallsyms]     [k] __softirqentry_text_start
     0.07%  kworker/0:2-eve  [kernel.kallsyms]     [k] vmw_goal_waiter_remove
     0.05%  kworker/0:2-eve  [kernel.kallsyms]     [k] vmw_cmdbuf_header_submit
     0.04%  kworker/0:2-eve  [kernel.kallsyms]     [k] __raw_callee_save___native_queued_spin_unlock
     0.02%  kworker/0:1H-xf  [kernel.kallsyms]     [k] ata_scsi_queuecmd
     0.02%  kworker/0:1-ata  [kernel.kallsyms]     [k] __softirqentry_text_start
     0.02%  kworker/0:1-ata  [kernel.kallsyms]     [k] e1000_update_stats
     0.02%  kworker/0:1H-xf  [kernel.kallsyms]     [k] __softirqentry_text_start
     0.02%  sleep            ld-linux-x86-64.so.2  [.] intel_check_word.constprop.0
     0.01%  kworker/0:1-ata  [kernel.kallsyms]     [k] e1000_clean
     0.01%  kworker/0:2-eve  [kernel.kallsyms]     [k] ata_scsi_queuecmd
     0.01%  kworker/0:1-ata  [kernel.kallsyms]     [k] ata_sff_pio_task
     0.01%  sleep            ld-linux-x86-64.so.2  [.] init_cpu_features.constprop.0
     0.01%  swapper          [kernel.kallsyms]     [k] e1000_clean
     0.00%  kworker/0:2-eve  [kernel.kallsyms]     [k] __softirqentry_text_start
     0.00%  kworker/0:2-eve  [kernel.kallsyms]     [k] drm_mode_object_put
     0.00%  swapper          [kernel.kallsyms]     [k] e1000_alloc_rx_buffers
     0.00%  swapper          [kernel.kallsyms]     [k] e1000_xmit_frame
There are several other use cases of the perf command for which this blog would not be enough. I learned something new with this exploration and I hope you learned something too.
Interested in exploring tools to send concurrent requests to a web server, check out my previous blog post.